Sampling is a process whereby you select units, such as people or businesses, from a population of interest. It’s an approach often used to understand characteristics about the population, and as such, requires the selected units to roughly reflect this population.
The challenge is when individuals or groups choose not to participate, or they are underrepresented due to constraints. For instance, a survey on movie preferences may collect information using a new phone app that is less popular with men. This is a problem if you want to understand the broader perspective – what is the most popular film genre – as the results will reflect only women’s views, which may be different than men’s preferences.
One approach to address this is to apply post-stratification weighting, whereby you weight the survey results so that responses that are over-represented in the sample (e.g. those from female users) have a lesser strength, while under-represented responses (e.g. those from male users) have an increased strength. The aim is to weight the data so the responses more closely represent the population of interest, and more importantly, you get a representative view of the most popular film genre among movie-goers.
How do you do this?
We need to first understand what the population of interest looks like. If you don’t know, for example, how many men and women there are in your population, you may be able to find this from other sources. A good place to start in New Zealand is to explore the very useful, Statistics New Zealand website: https://www.stats.govt.nz/
We can use these secondary sources to calculate the relevant population proportions. If you are interested in ensuring appropriate weighting is given to the different sexes, you could calculate this population proportion as: (1) the number of females divided by the number males and females (51.2%); and (2) the number of males divided by the number of males and females.
| Sex | Number of people in population | Population proportion |
| Male | 1000 | 1000/2050 = 0.488 |
| Female | 1050 | 1050/2050 = 0.512 |
| Total | 2050 | 1 |
You could then do a similar calculation with our completed survey population:
| Sex | Number of people responding to the survey | Completed survey proportion |
| Male | 40 | 40/150 = 0.266 |
| Female | 110 | 110/150= 0.733 |
| Total | 150 | 1 |
You could now calculate your weights. The equation for calculating each weight is:

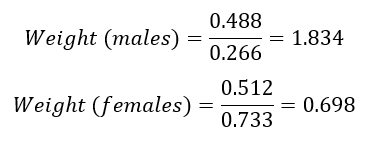
Using the previously calculated population proportion and the completed survey proportion we would get:

With a weight of 1.834 each response by a male has greater strength, and likewise, with a weight of 0.698 each female has a lesser strength. This should balance out the sample so that it better represents the population.
If you have collected multiple demographic variables (e.g. sex, age, ethnicity) then post-stratification weighting can be applied to multiple variables at the same time via a process called raking. That’s a separate blog.


